Transform Your Data Intelligence Today

Unlock insights with our tailored data consulting services.

Intelligence Readiness Audit

Assess your business intelligence readiness effectively.

Empower your team with industry-tested, ready and easy-to-use dashboards.

Elevate leadership with executive training programs and enhance your teams' data skills.

Dashboard Essentials
Intelligence Training

Empowering Businesses Through Data Intelligence

At EasyIntelligence, we specialize in data consulting, providing tailored solutions like dashboards and training to enhance your business intelligence and operational efficiency.

An iPad displaying data visualization content next to a book titled 'Data Science for Business.' The iPad is showing notes and a diagram about dashboard design, accompanied by a stylus placed between the iPad and the book.
Transformative insights for your business.

Client A

"

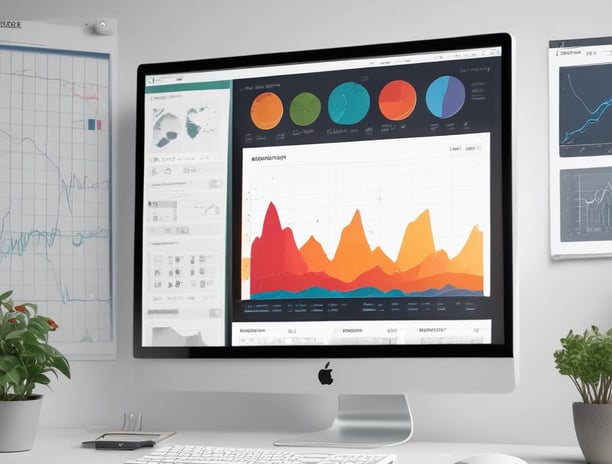
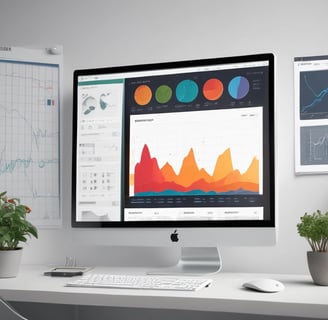
Data Intelligence Solutions

Transforming data into actionable insights through tailored consulting and innovative business intelligence services.

A computer screen displaying analytics dashboards with various charts, including a line graph on the left and a cohort analysis table on the right. The table is populated with different shades of blue, indicating varying levels of user activity over several weeks. Text labels and numbers detail user retention statistics.
A computer screen displaying a data analytics dashboard with graphs and charts. A blue line graph shows fluctuations in data over time, and a section highlights the number of page views. A pie chart is partially visible, indicating a breakdown of different data elements.
Intelligence Readiness Audit

Assess your Business Intelligence readiness with our comprehensive audit to enhance your data strategy and implementation.

Intelligence as a Product

Industry-tested dashboards, designed to visualize your data effectively, driving informed decision-making and efficiency.

EasyIntelligence transformed our data processes, making insights accessible and actionable for our entire team.

John Doe

A laptop with an open screen displaying dashboard analytics featuring charts, graphs, and numerical data related to sales and subscriptions. The interface is predominantly dark-themed with sections highlighting key performance metrics. The device shown is a MacBook Pro, indicated by the keyboard layout and branding.

★★★★★

gray computer monitor

Get in Touch

Contact us for data and business intelligence consulting services today.